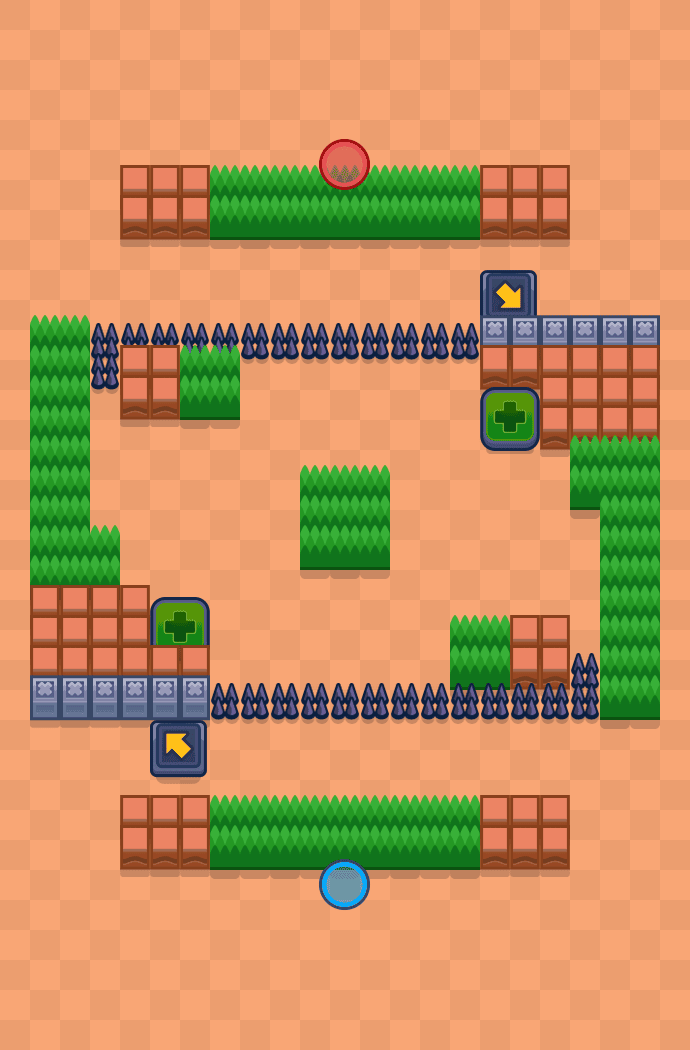
Team format: 3v3. The map pool and rotation status are live; the statistics come from this site's archived battle logs.
| # | Nimi | Voittoprosentti | Valintaprosentti | Otos |
|---|---|---|---|---|
| 1 | S SPIKE | 59.3% | 2.66% | 31,4 t. |
| 2 | S BO | 59.6% | 1.78% | 21 t. |
| 3 | S CARL | 58.7% | 2.09% | 24,6 t. |
| 4 | S GRAY | 57.4% | 2.97% | 35 t. |
| 5 | S MAX | 60.1% | 0.46% | 5,4 t. |
| 6 | S GALE | 56.4% | 2.17% | 25,5 t. |
| 7 | S CHUCK | 55.4% | 3.34% | 39,4 t. |
| 8 | S MEEPLE | 58.8% | 0.43% | 5,1 t. |
| 9 | S JACKY | 55.6% | 2.19% | 25,8 t. |
| 10 | S R-T | 54.8% | 3.09% | 36,5 t. |
| 11 | S LEON | 55.3% | 1.96% | 23,1 t. |
| 12 | S LOLA | 55.8% | 1.33% | 15,7 t. |
| 13 | S PEARL | 57.6% | 0.39% | 4,6 t. |
| 14 | A MOE | 54.1% | 3.07% | 36,2 t. |
| 15 | A KIT | 54.9% | 1.62% | 19,1 t. |
Win rates are measured over battles archived here — each row is the perspective of players who visited this site, so the overall figure sits above 50%; this is a sample, not a census. In survival modes a top-half placement counts as a win. "vs mode avg" compares each map against the mode's overall sample win rate — the wider the gap, the more one-sided the map tends to play. Maps with fewer than 50 decided battles show —; the trophy delta counts trophy-league battles only.